Recourse Analytics

See what your IDR program is really doing.

Every dispute, every arbitrator, every payer, in one place. Your own data next to the public CMS file. The same dashboard we use when we file, now available on its own.

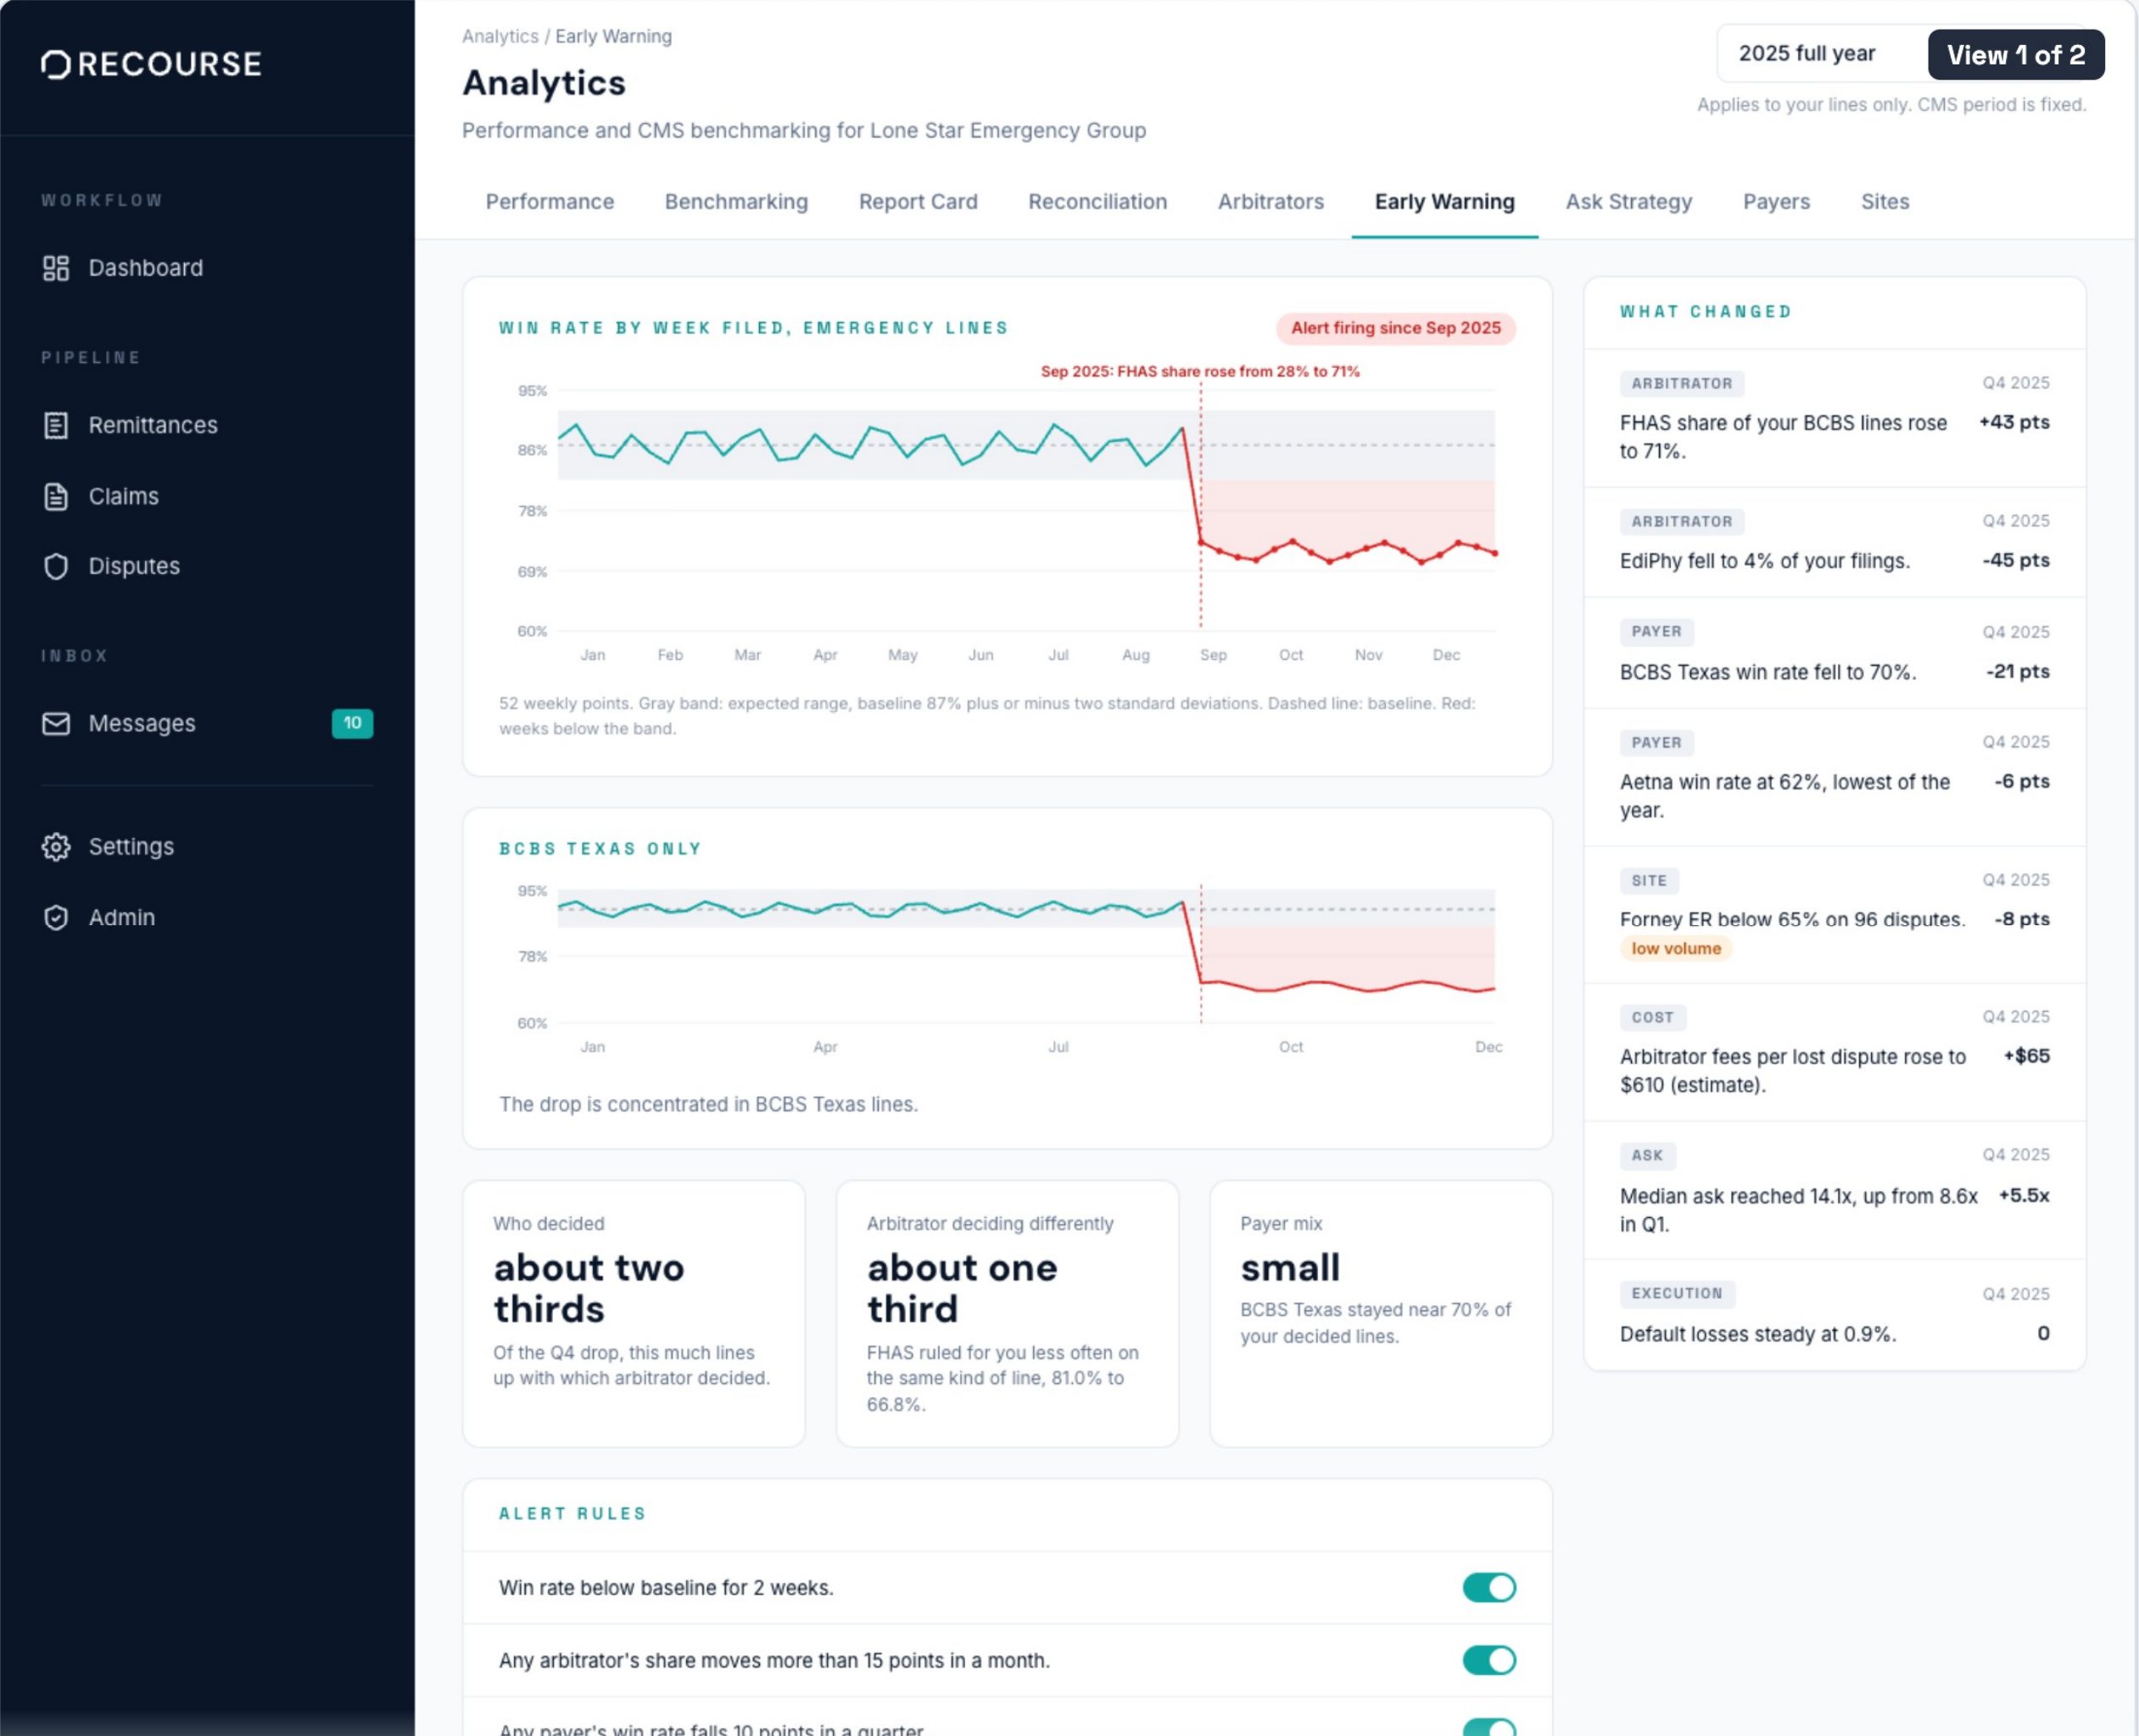
Recourse Analytics early warning screen showing win rate by week with a control band and the week the drop started
Screens show Lone Star Emergency Group, a sample customer. Numbers are illustrative.

Why win rate is not enough

The number most teams track is the one that hides the money.

CMS decided 2.18 million disputes in 2025. We read every one. Three things in that file change how you should run your program.

Win rate hides money

The filers who win the most recover the least.

In 2025, filers who asked 2.62x QPA won 88.1% of decided lines and recovered 2.08x. Filers who asked 19.3x won 76.0% and recovered 9.71x. Your ask decides your recovery. Win rate does not.

CMS is late

A drop in Q4 shows up the next summer.

The public file lands months after a quarter closes. By the time it tells you something changed, two more quarters have gone out the same way.

Your arbitrator mix is invisible

Who decided your lines changes what you win.

The same book, the same payers, and a different arbitrator can move your win rate by 25 points. You cannot see that in your own system. It takes the whole CMS file sitting next to your file.

Source: CMS Federal IDR Public Use Files, 2025 Q1 to Q4. Filers sorted by ask into four groups of equal claim volume. How we count

One dashboard, two ways to get it

If we file for you, it is included. If you file yourself, you can buy it.

RecoveryWe run every step of IDR for you. You pay from what we recover. The dashboard comes with it.How Recovery works
AnalyticsYou keep filing. We show you the whole picture, your data next to the public file, every week.You are here

Three screens that point at a decision

Most dashboards report. These tell you what to change.

Nobody else has an arbitrator screen. It takes the whole CMS file next to your file. That is what we have, because we file too.

Arbitrators

Who decided your lines, and how it went.

Every arbitrator that touched your book. Your share of lines, your win rate with them, the market's win rate with them, days to decide, and fee. Same claims, same payers, different outcomes.

Lone Star, 2025: EdiPhy fell from 49% to 4% of lines. FHAS rose from 28% to 71%. Win rate at FHAS went from 81% to 67%.
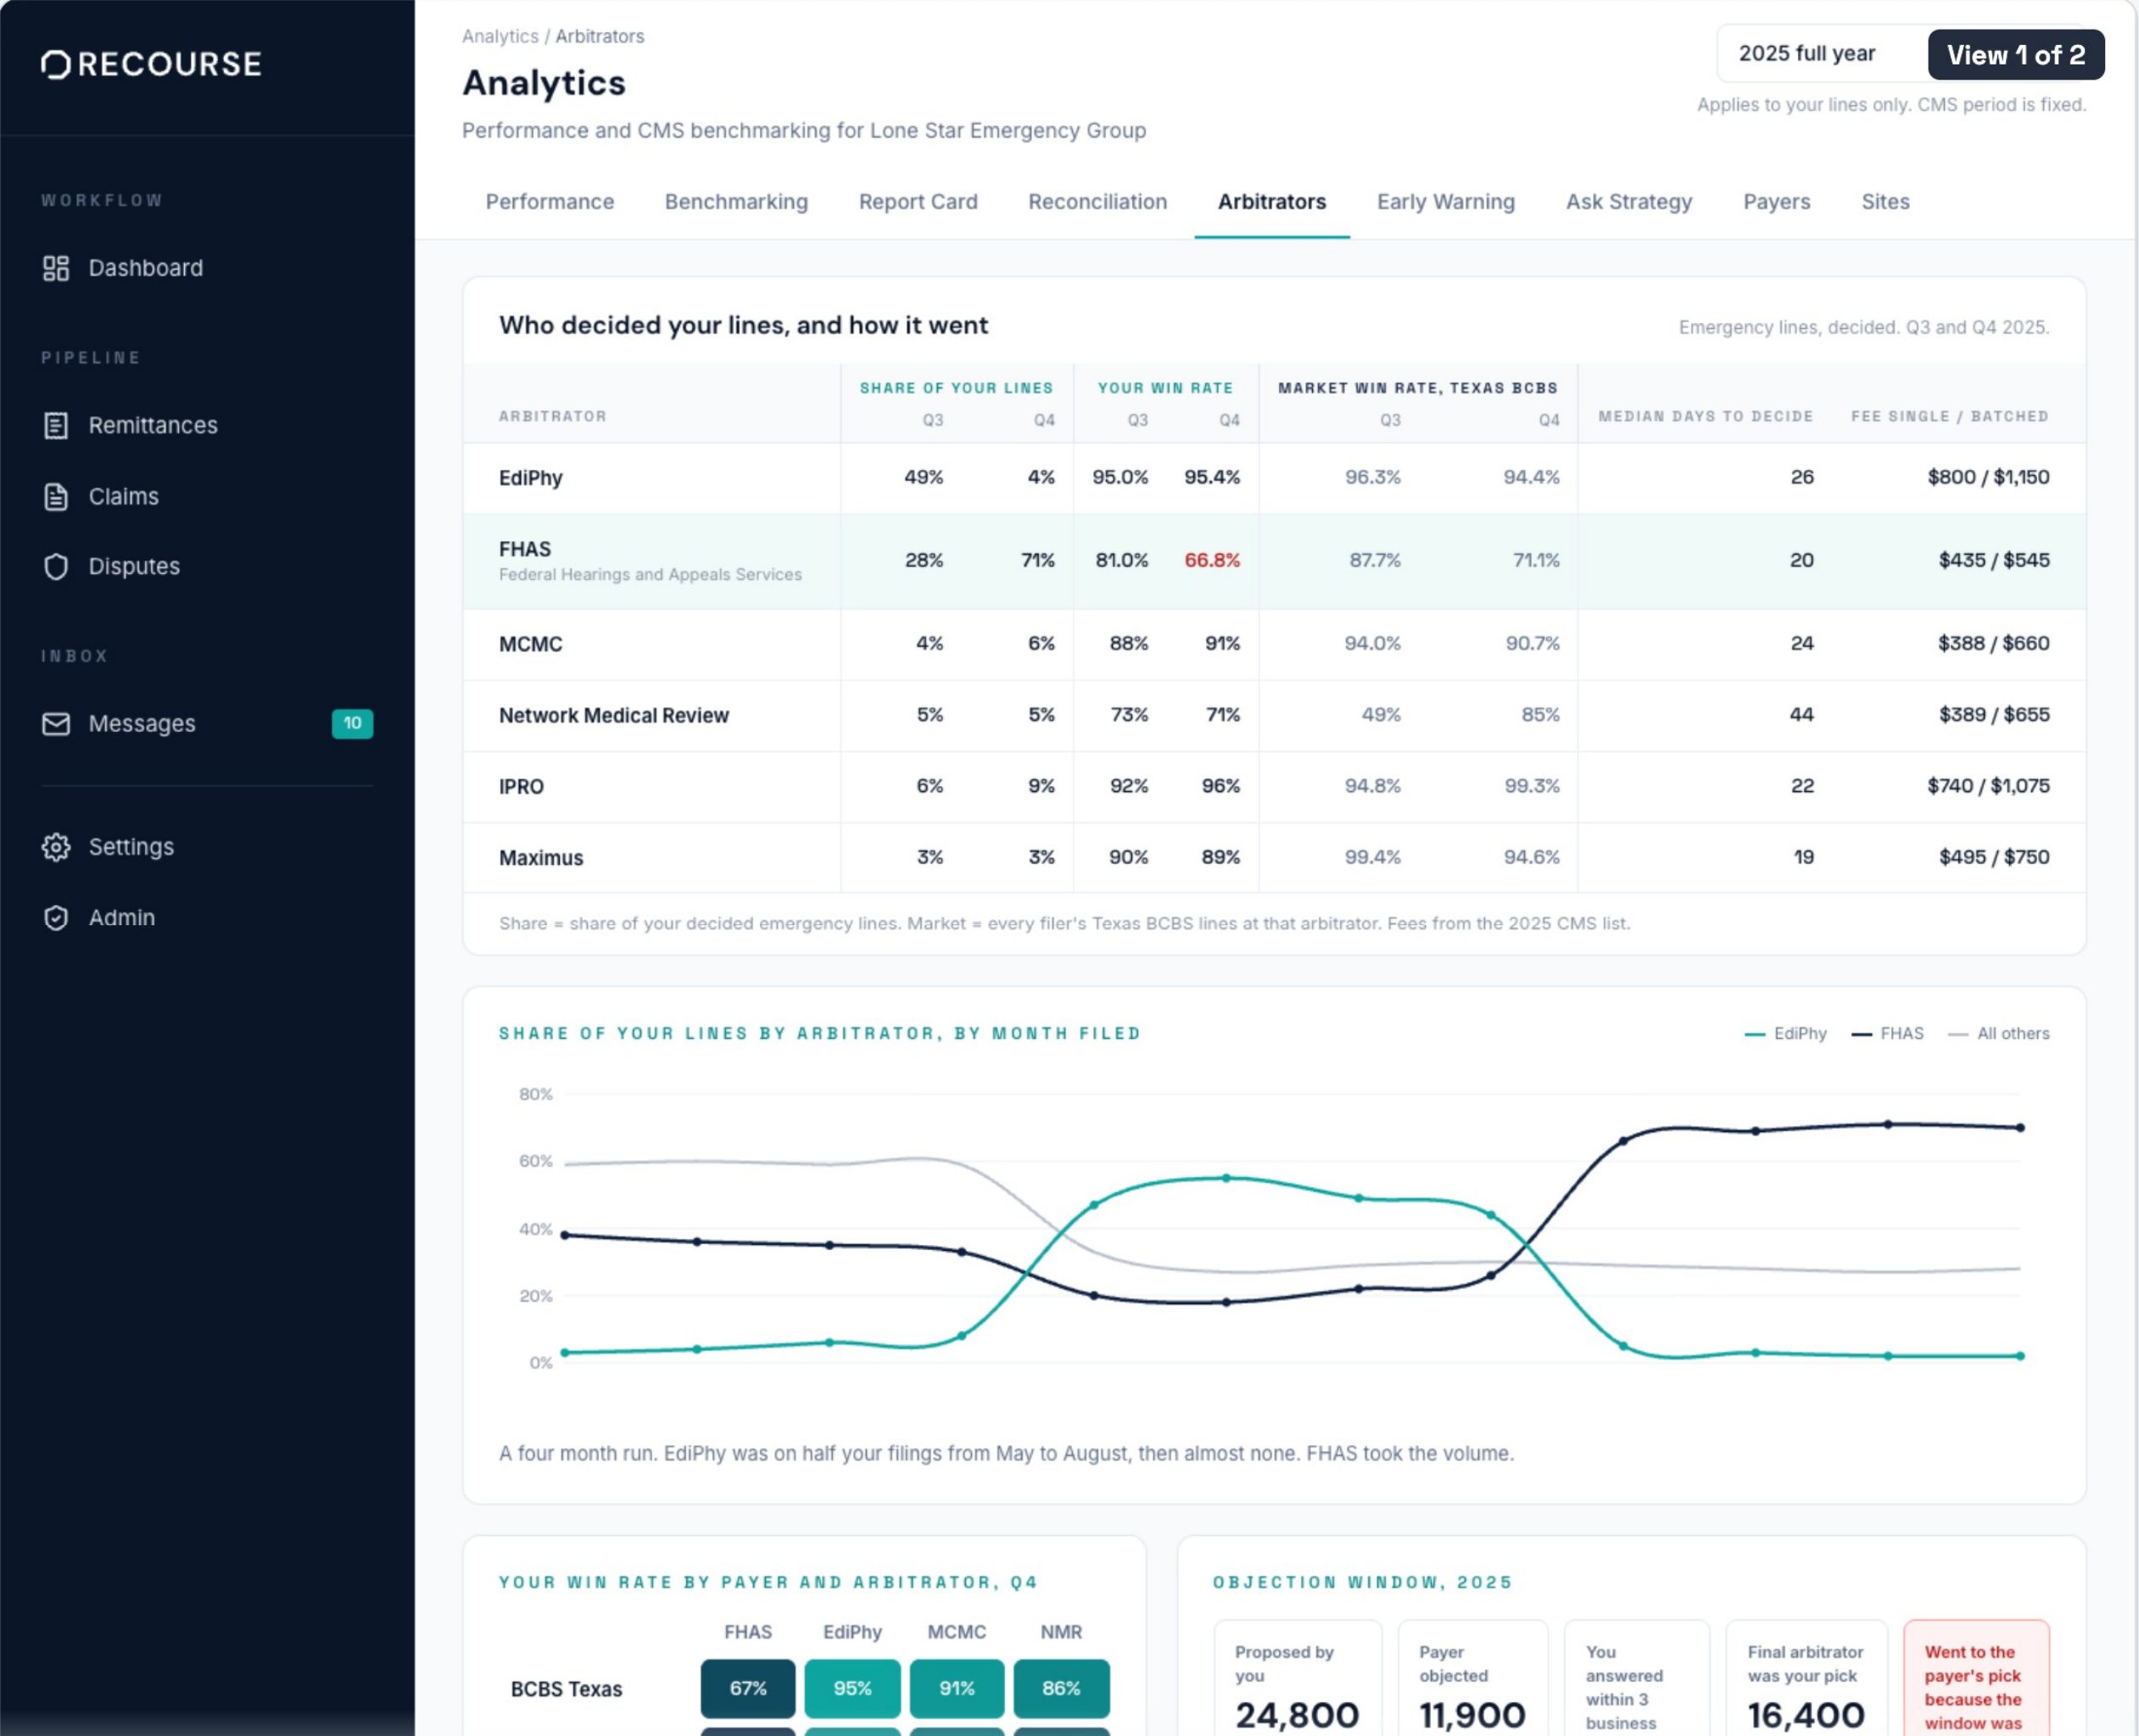
Arbitrators screen showing share of lines, win rate, market rate, and days to decide for each IDR entity

Early warning

The drop, the week it happens.

Win rate week by week, with a control band around it. The alert fires the week a number falls outside the band. Not the quarter after. Not when CMS publishes.

Lone Star, 2025: steady near 87% through August, then 70 to 73%. About two thirds of the drop lines up with who decided.

Early warning screen showing weekly win rate with a control band and the week the alert started

Ask strategy

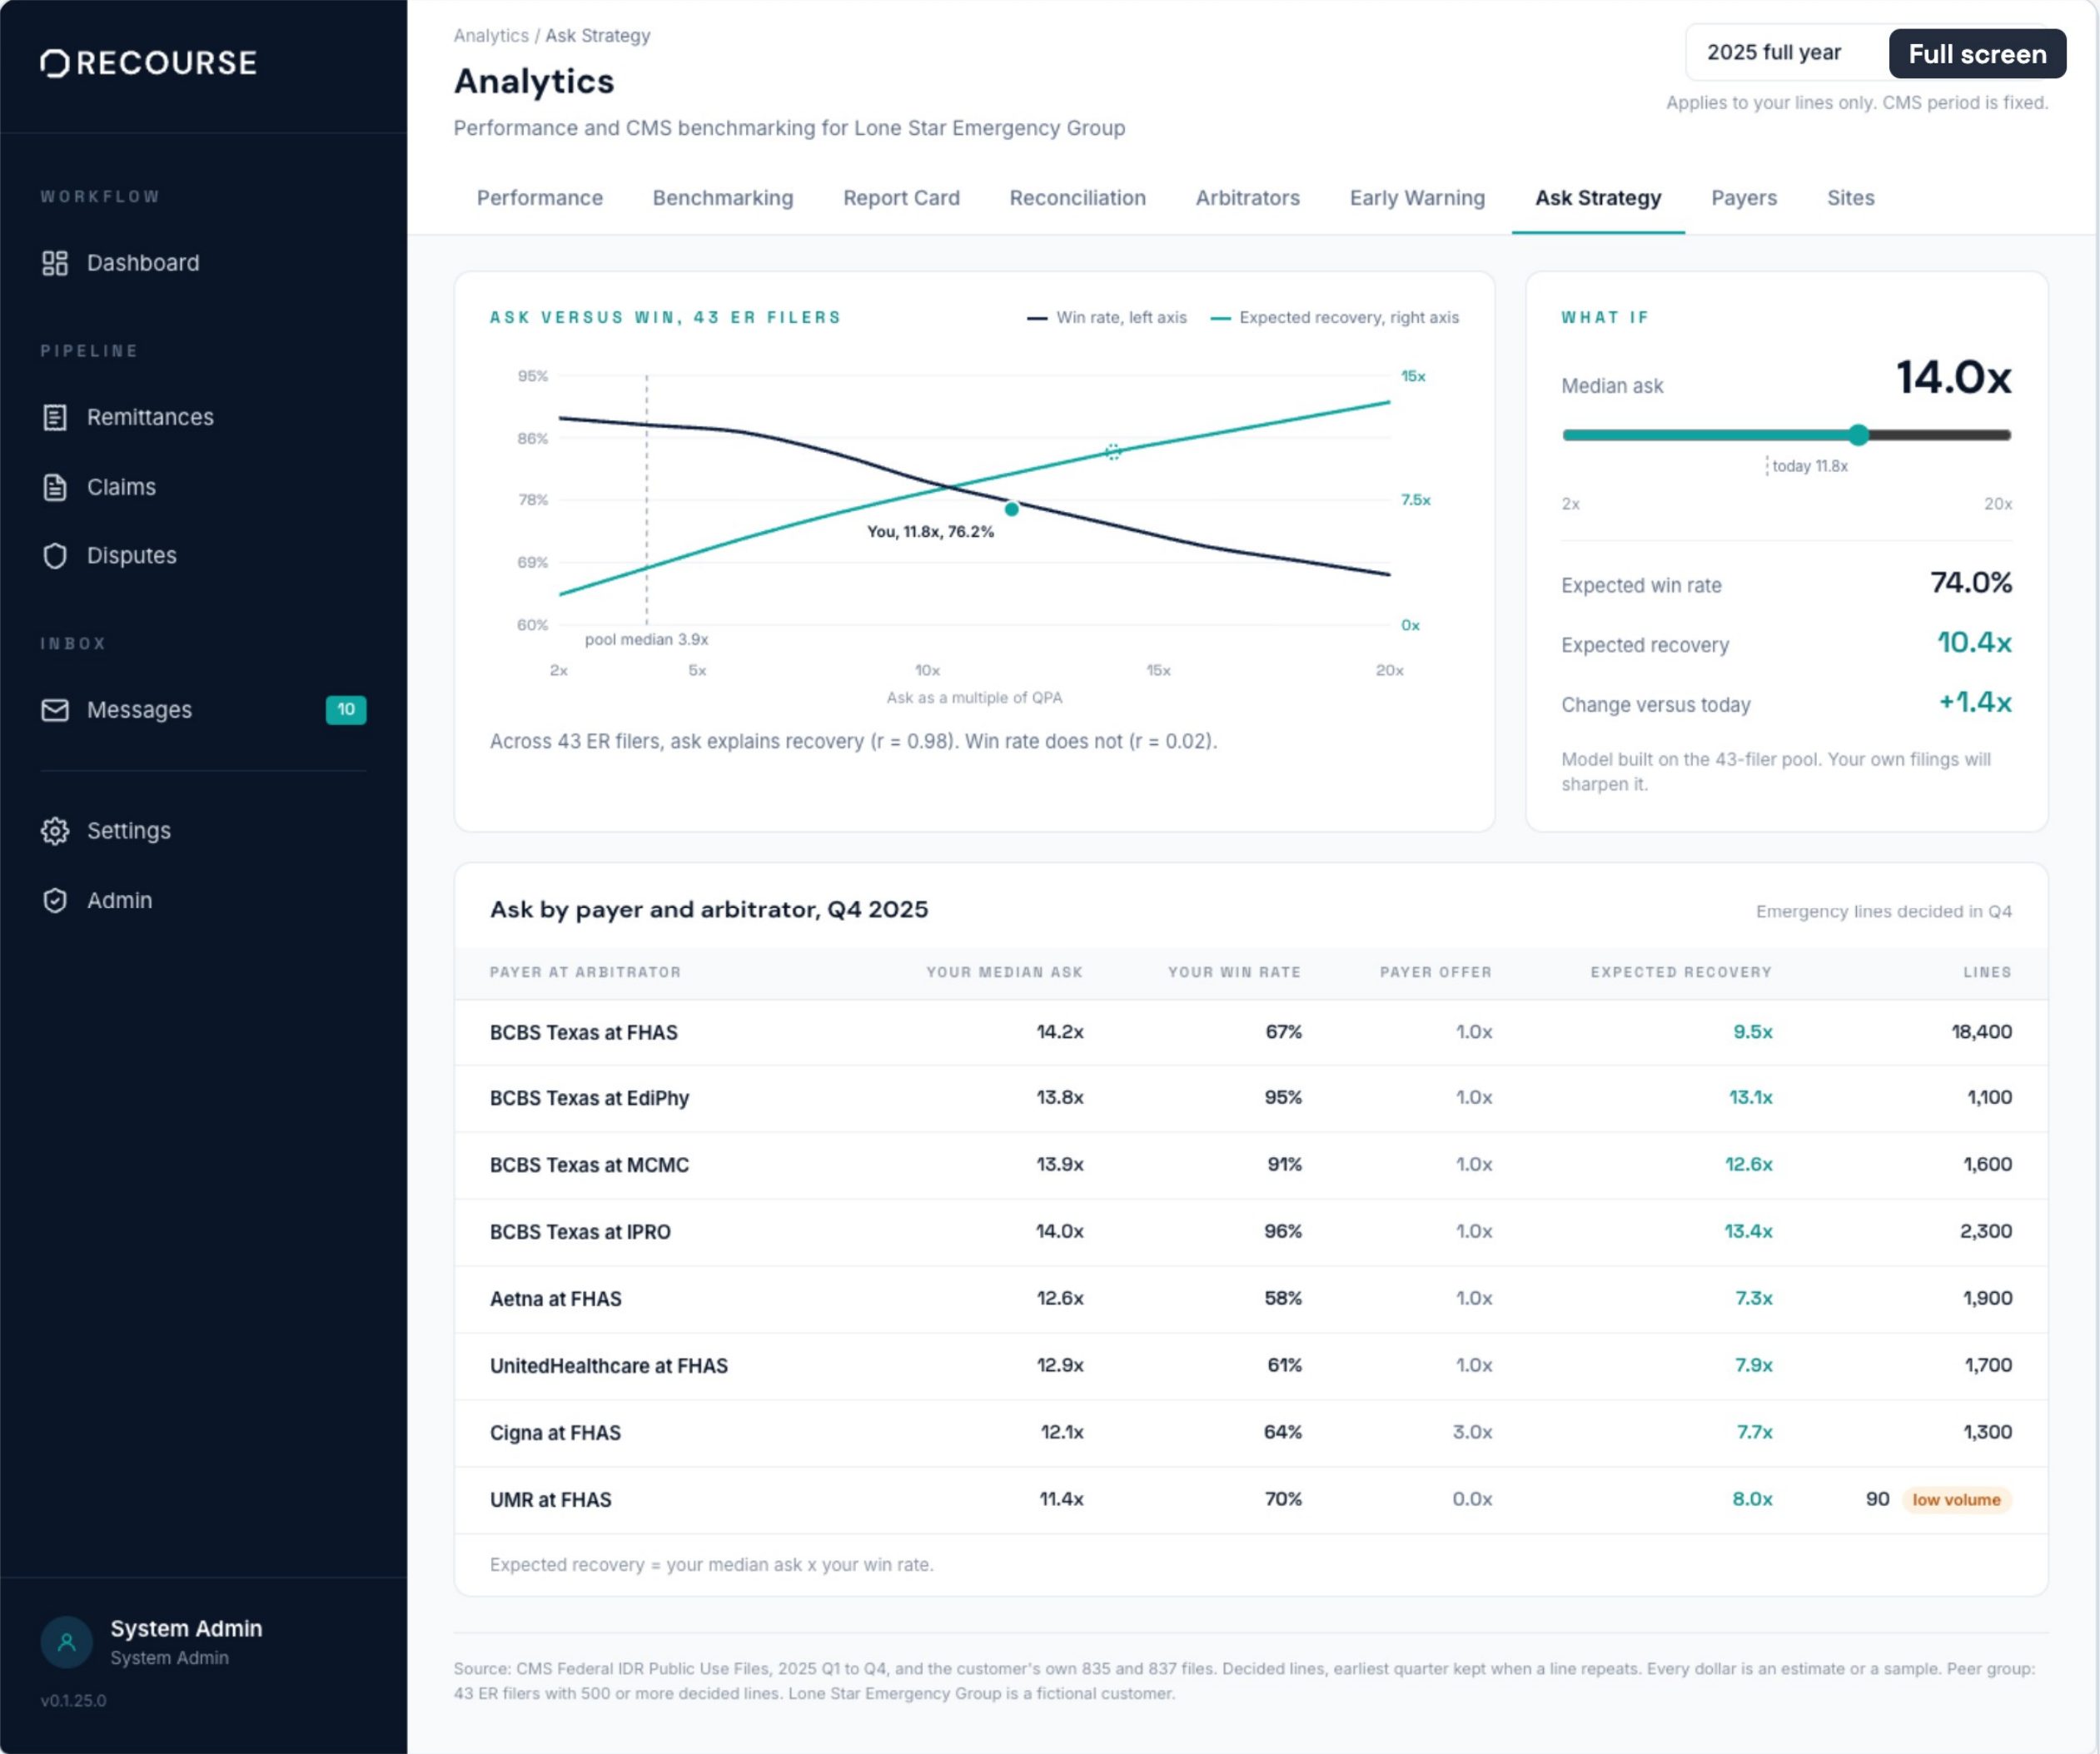
What you asked, what you won, and what a higher ask would have paid.

Across the 43 emergency filers with real volume, ask explains recovery and win rate barely moves it. This screen shows where your ask sits, and what moving it does to what you get paid.

Lone Star, 2025: at an 11.8x ask, 76.2% win. At 14x, 74.0% win and 10.4x recovery. That is 1.4x more on every line.

Ask strategy screen showing ask level against win rate and recovery across peer filers

Also in the dashboard

Everything else you would expect. One place.

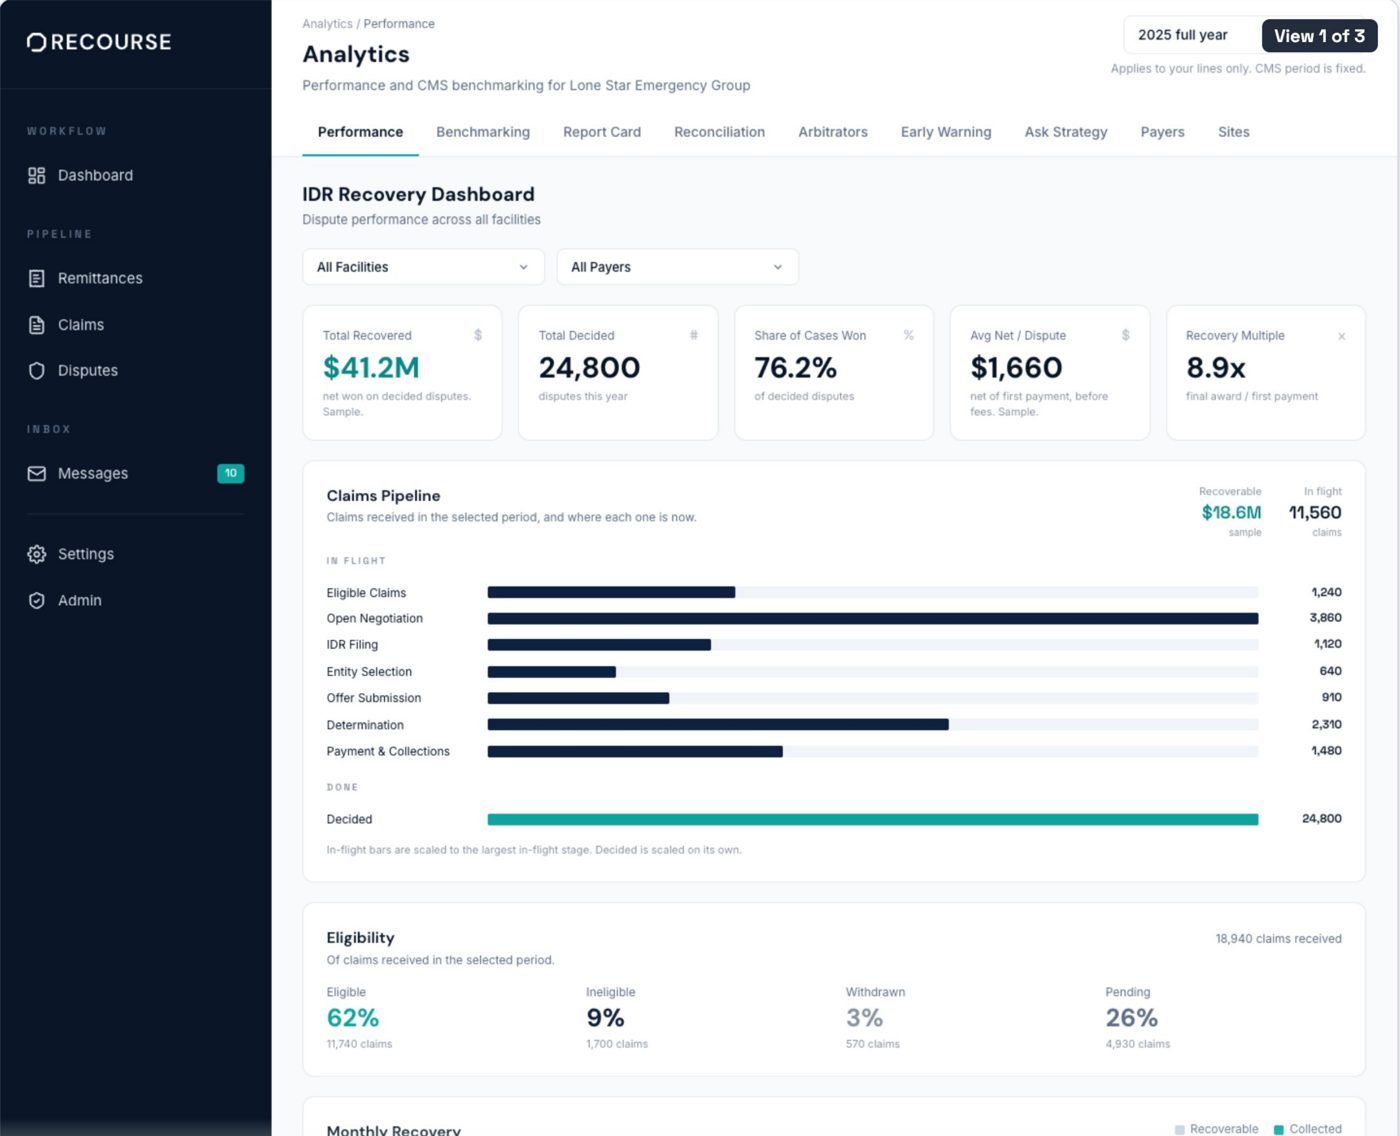
Performance screen

Performance

Dollars recovered, win rate, and recovery multiple. By facility and by payer. Live.

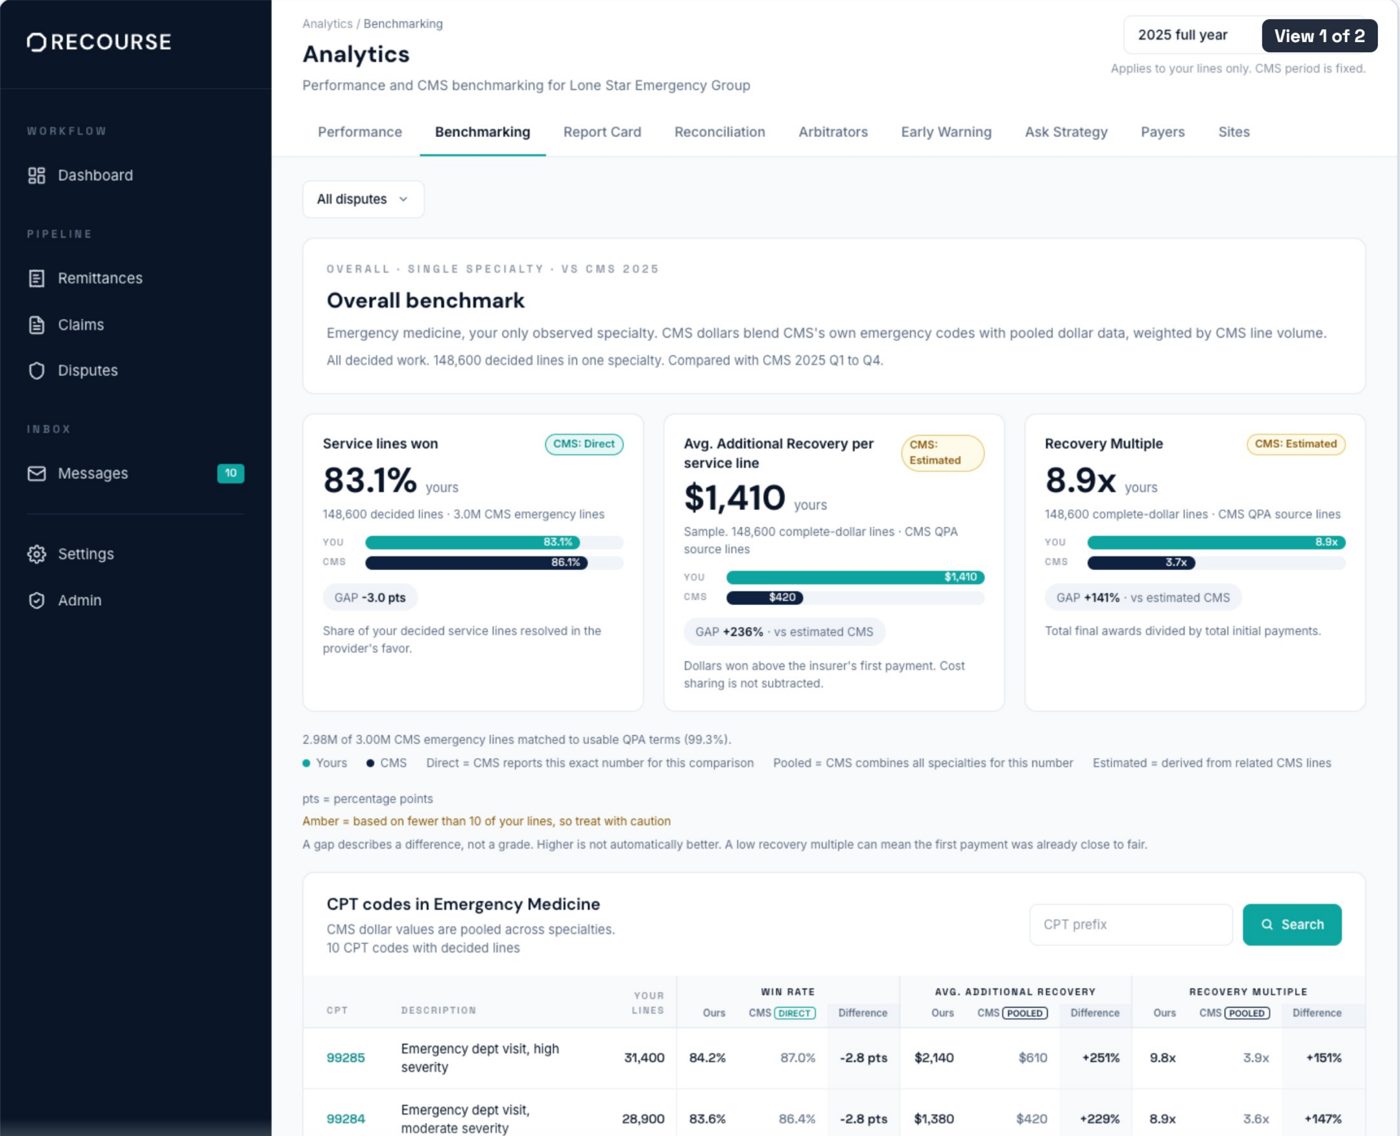
Benchmarking screen

Benchmarking

Your numbers against the CMS file, down to the CPT code. Updated with every CMS release.

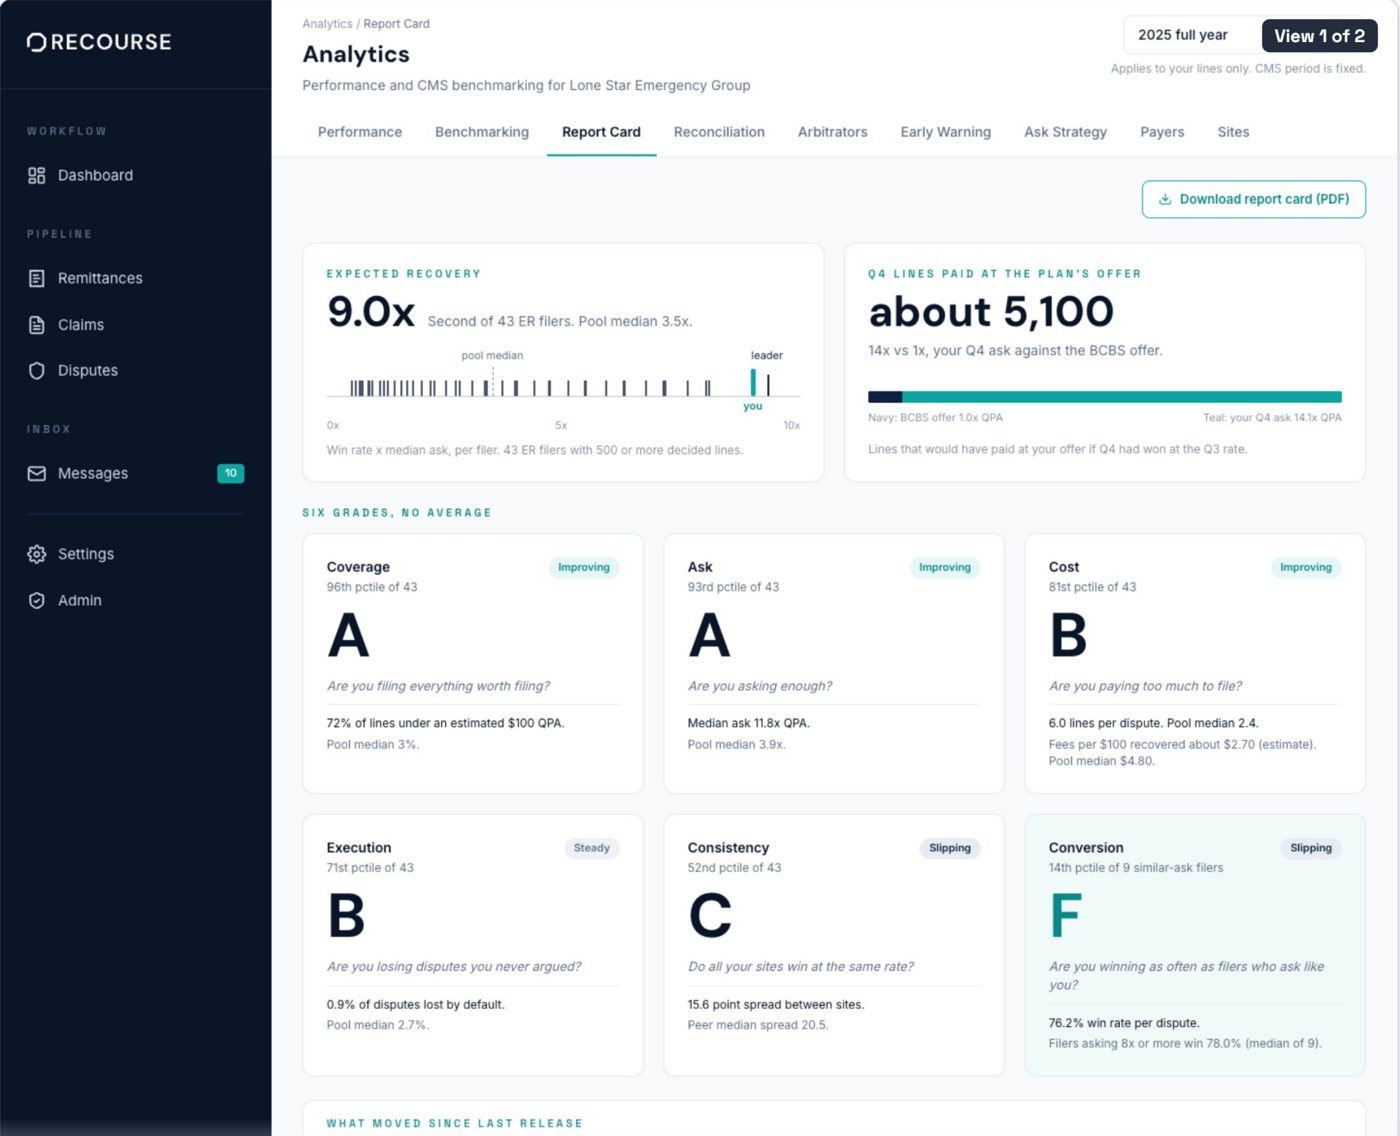
Report card screen

Report card

Six grades against your peer group. No average, so nothing hides.

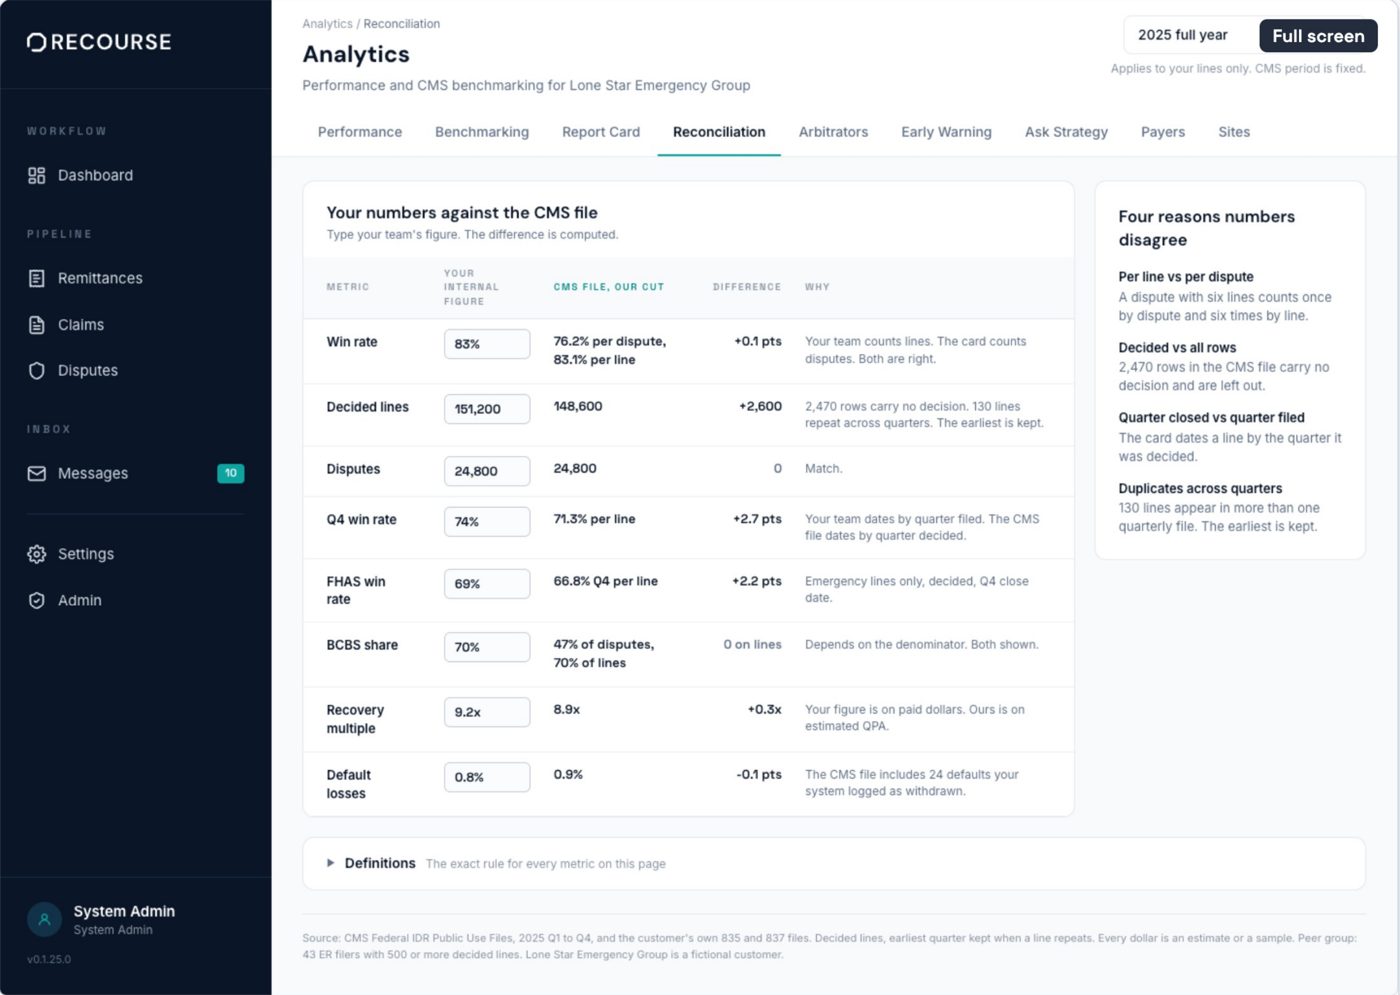
Reconciliation screen

Reconciliation

Your internal numbers next to ours, and the four reasons they differ.

Payers screen

Payers

Who got tougher and who got softer, quarter by quarter.

Sites screen

Sites

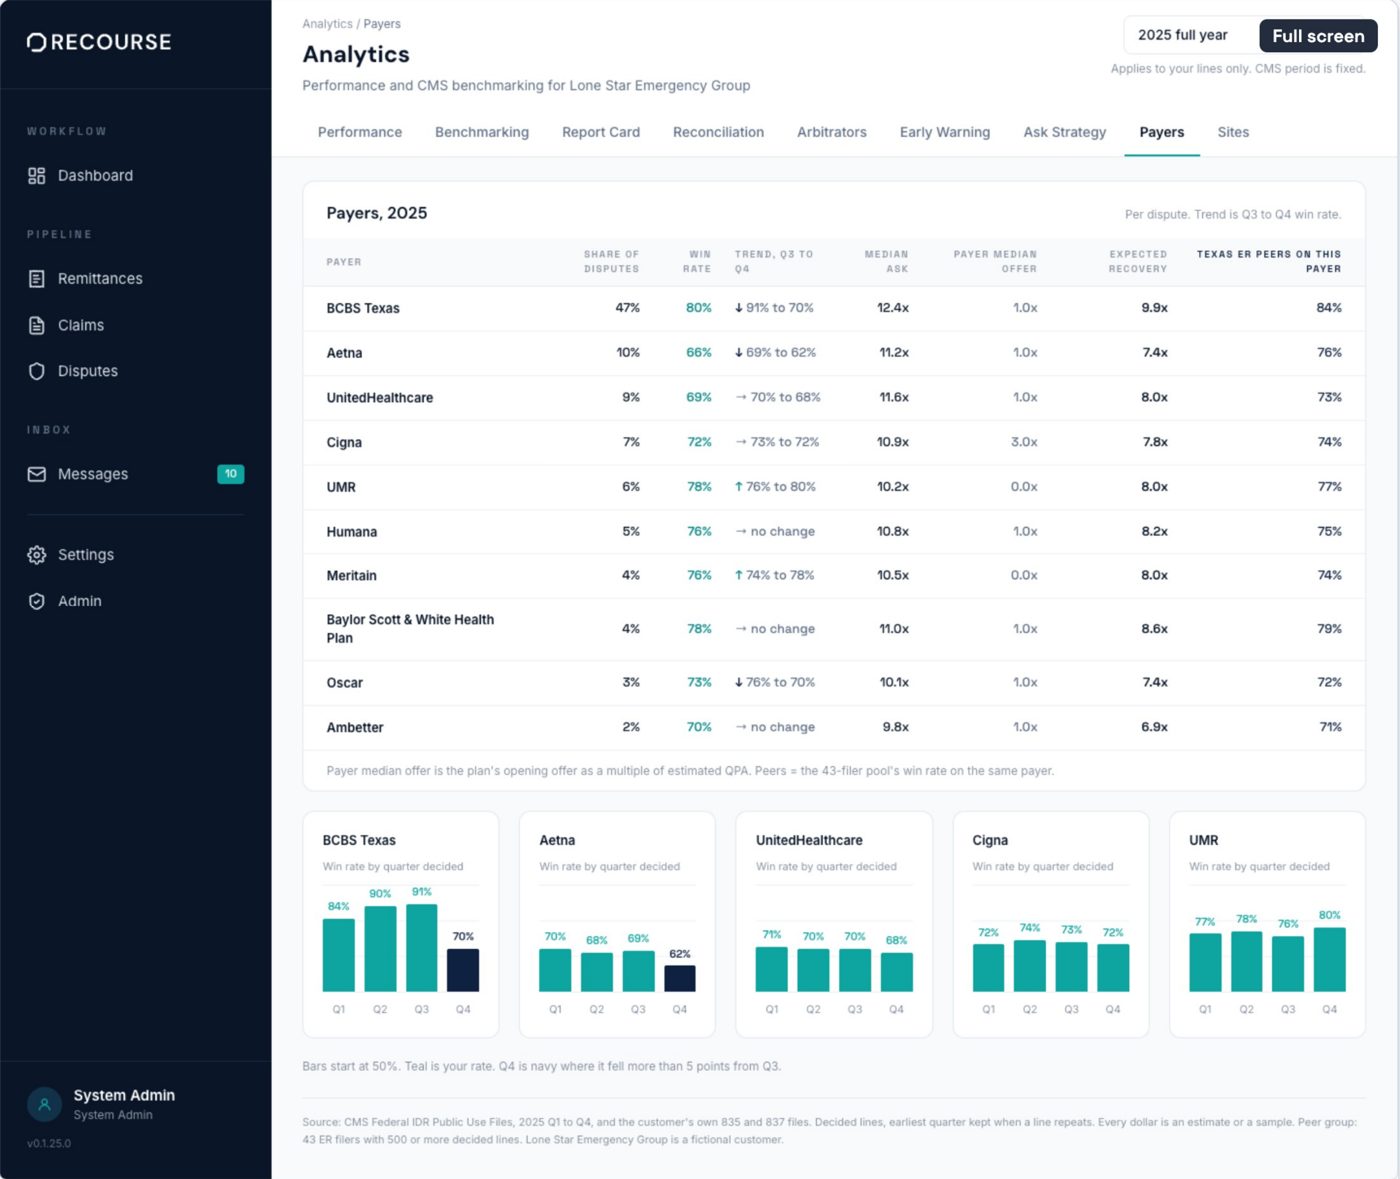
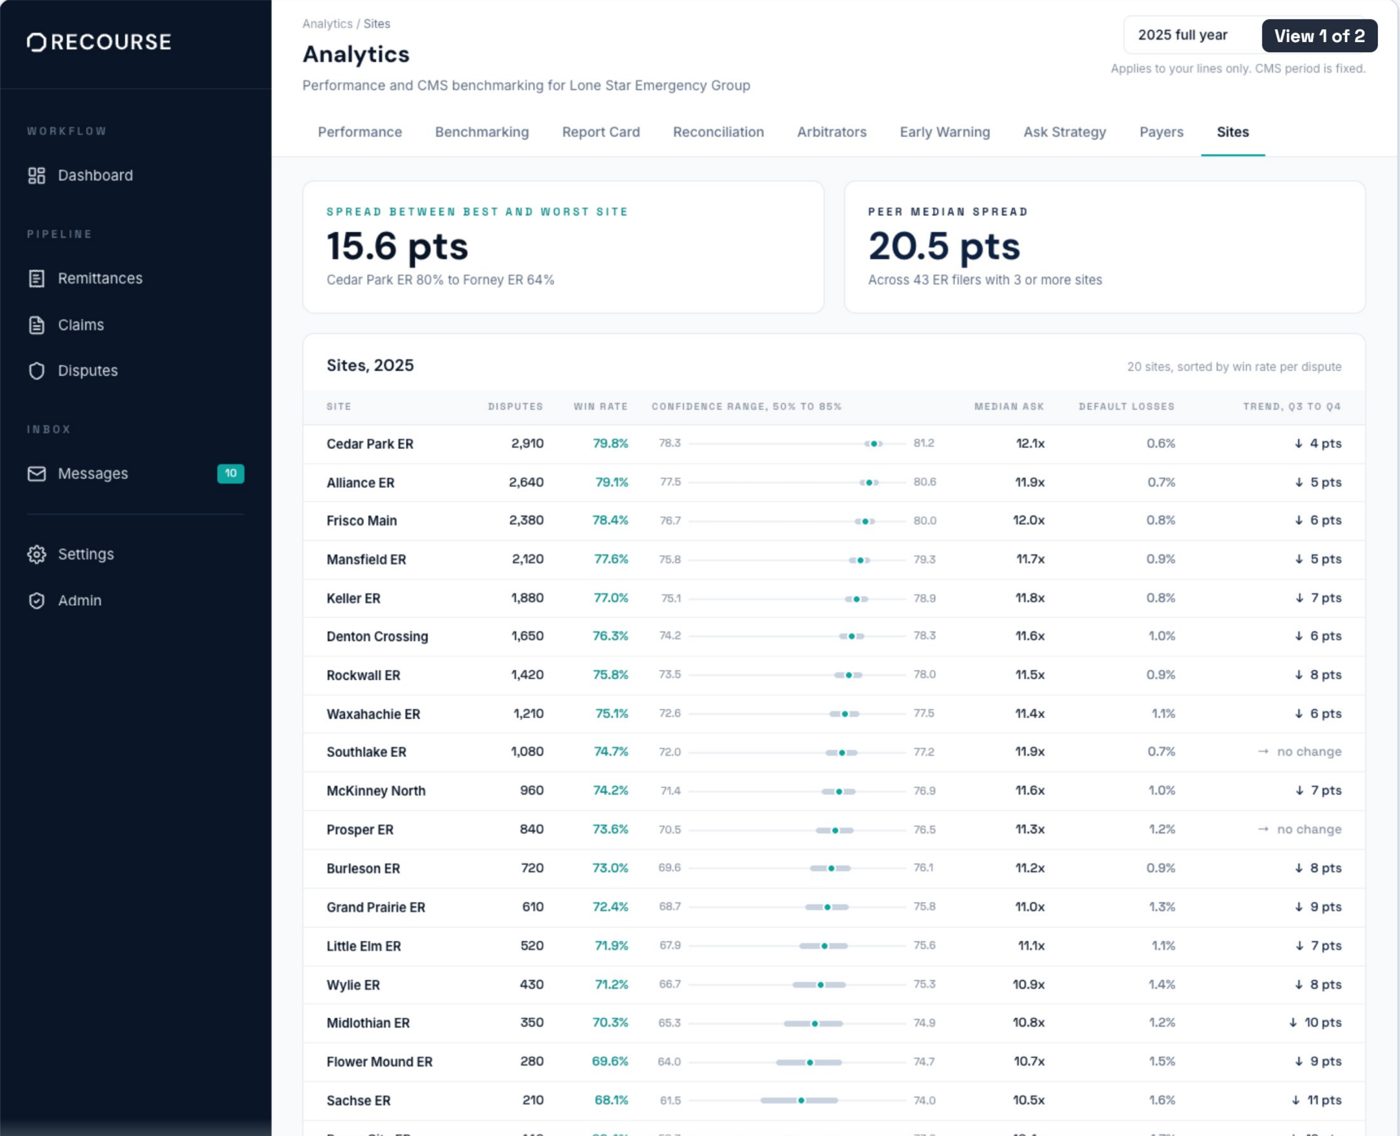
Every facility ranked, with a confidence range so small sites do not mislead.

Who it is for

Teams that already file, and want to know if they still file well.

Built from filing, not from a spreadsheet. Every number on these screens is a number we act on when we file for our own customers.

Groups that file themselves

You have a team and a process. This shows you what the file says about it, before your payers do.

Systems with many sites

Twenty ERs on one screen. Which sites win, which ask low, and which miss deadlines.

Billing and RCM firms

Your clients can pull the same public file. Better you see it first, client by client.

Easy to adopt. Built for healthcare.

Built to fit your operation, not replace it.

Your team keeps working in the systems it already uses. Recourse starts with the standard 837 and 835 files you already produce and runs IDR alongside your current workflow. Remedy never decides a money line or a counter-offer on its own: those come to your team with the reason written down, and it only acts alone after 50 clean confirmations.

  • Works from your existing 837 and 835 files
  • No new system of record
  • BAA available for handling PHI
  • Least-privilege access, audit logging, and encryption in transit and at rest

Book a demo

See it on your own disputes.

Thirty minutes. Bring last quarter. We show you what the public file says about it, and what the dashboard would have caught.

  • Your last quarter, dispute by dispute
  • Who decided your lines, and how it went
  • Where your ask sits against filers like you
  • The week anything moved, and why

Request a demo

No data needed for the demo. A BAA is available before any claims data is shared.